Creating Virtual Corridors: Social Network Discovery and Landscape Patch Connectivity of Permaculture Projects and Initiatives on Facebook
Jabez Joshua M. Flores1, Rick Jason Obrero2, Luisa A. Gelisan3, Edward Allan Foronda4, and Rikki Lee Mendiola5
1Alumnus, University of the Philippines Open University, Philippines, [email protected]2Instructor I, University of the Philippines Los Banos, Philippines, [email protected]
3University Researcher II, University of the Philippines Open University, Philippines [email protected]
4Permaculture Practitioner, Philippines, [email protected]
5University Extension Specialist I, University of the Philippines Los Banos, Philippines, [email protected]
Abstract
Permaculture is a design system conceptualized in Australia in the 1970s in response to urgent environmental issues at that time. Mainstreamed via social media in recent years, permaculture is being practiced around the world on diverse landscapes. The study aimed to discover socio-spatial permaculture landscape networks based on a permaculture designer’s Facebook social network. Using social network theory and landscape ecology, the study simulated and predicted how permaculture designers would be able to create invisible landscape corridors called “virtual corridors.” Virtual corridors are determined by computing for the Percentage Linkage Strength (%LS) metric derived from data obtained from two scoring systems developed for the study: the Social Score (SS) and the Permaculture Score (PS). Two hundred eighty six network nodes were initially discovered to be potential permaculture designers via Facebook Group membership. The two scoring systems revealed the top ten network nodes with the highest computed %LS that created virtual corridors. A Meerkat Lite-generated sociogram overlayed on a Google Earth topographic map animated in Camtasia Studio were used to illustrate the discovered network. Then NetLogo was used to simulate and predict the virtual corridor creation process. In the future, the methodology could be used to determine potential study sites for transdisciplinary permaculture research and study the environmental impact of permaculture projects and initiatives on landscape patches. It would also provide practitioners and researchers a framework to better understand how a network of individual solutions could lead to macro-scale landscape patch management.
Keywords: virtual corridors, landscape ecology, organic agriculture, environmental management, sociology, virtual communities
Introduction
How does Facebook enable people to practice permaculture in real life? This question was inspired by Facebook users’ posts showing photos of their personal garden projects and the countless gardening stories, blogs, and memes shared on Facebook newsfeeds nowadays. With increased online activity mostly documenting the daily lives of people, one has to wonder how such activities impact the real world. More specifically, how do these activities translate to the actual practice of permaculture?
Permaculture is a design framework used by individuals and communities with green and progressive worldviews (Hillis, 2011) in the alternative farming systems movement. It is a perfect example of ‘feral ecology’-- ecological discourse outside of the academe as coined by Morris (2012). And in the context of the study, ecology discussed on Facebook. With widespread access to Information and Communication Technologies (ICT), permaculture designers have relied on communication channels and social media platforms, such as Facebook, to disseminate permaculture educational materials, how-to guides, do-it-yourself projects, and training courses to netizens (Hillis, 2011). Permaculture provides accessible and practical solutions to food security (Ferguson Lovell, 2013) and small-scale landscape patch management. Undocumented and often under-the-radar from scientific research in the Philippines, the environmental and socio-ecological impacts of permaculture remain a mystery.
The idea for “virtual corridors” was borrowed from landscape ecology’s concept of a “corridor”—a landscape element that resembles a linear strip of land or an elongated landscape patch (Chen, et. al. 2006) that physically links patches together while administering species movements from one habitat to the other (Bennet, 2003). Corridors are important because it increases landscape connectivity among patches and thus allowing landscape heterogeneity and biodiversity via the exchange of plant and animal species, materials, energy, and resources. Adding the word, “virtual” to the concept of landscape corridors indicates the online and intangible nature of the corridor which can only be seen in a social network map (called a sociogram) graphically represented as a line called a network edge. Though the corridor exists outside of physical reality, the numerical expressions that make up the network edge are based on the existence of social relationships and physical landscapes. The study defines “virtual corridors” as referring to a network edge, acting like a landscape corridor, which virtually links and facilitates the “movement of permaculture” (transfer and exchange of information, technology, and energy) from a focal node to a network node in a social network. Creation of virtual corridors enables network nodes to form a network of virtual and physical spaces or a socio-spatial network.
Social networking and community-building have reached a whole new level thanks to widespread internet access via wireless fidelity (WiFi) hotspots and mobile data packages. Through this virtual world, individuals can easily exchange information with peers without spatio-temporal restrictions while online communities are being organized as we speak with just a click of a button. For researchers, social media introduced a new ‘world’ to explore and mine for data. Welcome to Society 2.0 (Morris, 2012).
Objectives
General Objectives
- To find existing permaculture social networks;
- To study these social networks and learn how they relate to ecological landscapes; and
- To create a foundational study for future permaculture research.
Specific Objectives
- To develop a methodology to discover network nodes in a permaculture-based socio-spatial. network;
- To create new metrics that could measure socio-spatial connectivity of network nodes; and
- To simulate and predict the virtual corridor creation process.
Theoretical Framework
The theoretical framework of the study explains landscape ecology theory as it relates to the practice of permaculture and the sharing of permaculture on Facebook as feral ecology using social network theory.
The framework recognizes four socio-ecological phenomena as it transitions from the ecological dimension to the social network dimension of the study:
- When ecological discourse goes feral and becomes permaculture.
- When permaculture is mainstreamed in social media (Facebook).
- When an individual and a landscape are discovered and represented as a single node in a social network.
- When social networks simultaneously create spatial networks.
- And when social linkages (or ties) act as “virtual” landscape corridors.
Landscape ecology is a sub-discipline of ecology and geography that highlight four core themes: 1) the influence of spatial patterns on ecological processes (Turner, 1989), 2) the importance of landscape heterogeneity (Pickett Candenasso, 1995), 3) the interaction of different types of landscapes (McGarigal, n.d.), and 4) the importance of spatial and temporal scales in analyzing landscapes (Turner, 1990). Landscape ecology is a transdisciplinary science (Naveh, 1999) that extends its scope beyond natural systems to socio-ecological systems recognizing the impact of human activities in creating and influencing landscape patterns and processes (McGarigal, 2001 n.d.). According to Sanderson Harris (2000), the landscape ecology theory emphasizes the role of humans in affecting landscape structure and function. It was determined in the analysis of socio-ecological systems that social systems are intricately linked with their respective ecological systems and thus are co-evolving and self-organizing to create a single landscape (Leser, 1991; Naveh & Lieberman, 1984; Naveh, 2000). Therefore, in landscape ecology analysis, human activities in social, cultural, political, and economic spheres are viewed as not separate from the reality of natural landscape processes and vice versa.
Landscape ecology theory includes the landscape stability principle (Forman & Godron, 1986) which states how landscape structural heterogeneity, or uniqueness, can help in resistance to and recovery from landscape disturbances and how heterogeneity contributes to the total stability of the system.
Permaculture incorporates systems thinking (Peeters, 2011) into a design framework that includes landscape ecology theory and the landscape stability principle together with other disciplines from the natural and social sciences and the humanities. In principle, the practice of permaculture in small to large-scale landscapes should lead to positive changes in the structure and function of socio-ecological landscapes. It is also believed to create a “permanent culture” (hence the term) of system stability and sustainable practices (like energy and nutrient cycling, creating microclimates, and organic agriculture) consciously designed by humans to work with nature (Mollison, 1988). One significant problem though is the lack of substantial scientific research (Ferguson Lovell, 2013) on the topic which hinders permaculture’s perceived effects on landscape from being conclusive.
The concept of what Morris (2012) calls “feral ecology” in Society 2.0 does not help justify the credentials of permaculture, though science-based, in the academe. Rather, it takes the discussion further away from the grip of academicians and tossed up for grabs into the collective hands of the masses in the virtual arena of the online social network, Facebook. Though “feral” is not a desirable word to be referred to, it does, however, describe how permaculture was shared from user to user expanding the geographical extent of its landscape management practices.
This is where the transition from the ecological dimension to the social network dimension begins. When a complex discipline, like landscape ecology, is packaged in a way that is comprehensible (permaculture) and accessible (via social media) to people, they begin to take ownership and action toward issues concerning ecology and the environment (Morris, 2012).
A study by Hillis (2011), “The Wired Village,” revealed that most of the respondents in the study spent a good amount of time on cyberspace (or online) and that they were heavy users of Information and Communication Technologies (ICT) such as mobile phones and laptops. With the internet and new gadgets, practices and social values were better shared and transmitted without spatio-temporal bounds.
Studying permaculture designers are worthy of research because their activities within their respective landscapes are potentially impactful on landscape structure and function given their shared knowledge and social values based on permaculture.
As permaculture spreads rapidly on social media, the application of social network theory and social network analysis could provide valuable insights into how the relationships of these people (represented as nodes in a sociogram) in an online social network translate into a pattern of offline spatial networks wherein individual permaculture designs (Peeters, 2011) in their inhabited physical spaces were virtually linked across landscapes patches.
The discovery of network nodes, ties, and the creation of virtual corridors, though not literal physical corridors in a landscape ecology sense, provides an invisible linkage that connects individuals and their corresponding landscape patches (together represented as a single node). Nodes become homophilous, meaning that nodes with strong linkages are more similar to each other (Borgatti Lopez-Kidwell, 2011) in terms of shared values, practice, and inhabited physical spaces. Therefore, virtual corridors are invisible landscape corridors based on strong homophilous online relationships and shared permaculture practices.
Methodology
The study was conducted to identify influential respondents, referred to in this section as network nodes, with high Percentage Linkage Strength (%LS) which created virtual corridors within the focal node’s (one of the researchers who was a permaculture designer) social network. Virtual corridors were “invisible” digital highways where permaculture experiences were effectively shared and manifested as actual projects. The %LS could only be measured if the focal node was a permaculture designer.
The population for the study was taken from the focal node’s current roster of Facebook friends as of January 2016. The focal node has been a member of Facebook since 2011 and has a total of 1,267 friends at the time this report was written.
Methods of Node and Tie Discovery
To determine the sample size of the network nodes to be studied, the Facebook Group feature was utilized to determine which friend (or network nodes) were either interested in or practicing permaculture.
Facebook groups were classified by accessibility and can either be public, closed, or secret groups that a user could join upon request or invitation from a designated “group administrator.” A user could also create and manage his/her own Facebook group. The feature enables users to create and join groups that cater to a specific interest, hobby, organization, business and just about any purpose anyone could think of.
For the research’s purpose, the Facebook group feature conveniently clustered the focal node’s Facebook friends into specific areas of interest or themes to identify ties or the similarities between network nodes. For this study, eighteen (18) Facebook groups that revolve around permaculture- specific or permaculture-related themes (specifically agriculture and food) were identified to draw samples from. Three of these Facebook groups were created by the focal node who was also a member of the other fifteen (15) groups. Table 1 shows the Facebook groups used for this study and the number of his friends included in each group (friends could be members of more than one group).
Two hundred eighty six out of 1,267 friends (22.57%) were identified as members of the eighteen Facebook groups selected for the study (with 69 friends or 24% being members of at least two or more groups). The 286 friends who qualified as network nodes could also potentially create virtual corridors based on similarity of Facebook group affiliation.
Relationship and Role Identification
To determine which network nodes could create virtual corridors, a metric called Percentage Linkage Strength (%LS) was developed specifically for this study to describe shared permaculture experiences or “permaculture-based” relationships of the respondents to the focal node. The metric used a combination of quantitative data mined from Facebook and firsthand qualitative data provided by the researcher to compute the %LS.
It must be noted that the %LS metric, as used in this study, was limited to the theme of permaculture only. It did not measure or describe the complete relationship of the respondents to the researchers.
There were two scoring systems developed for the computation of the %LS: 1.) the Social Score (SS) and 2) the Permaculture Score (PS).
Computation of Social Score (SS)
The SS referred to the number of interaction and similarities that respondents had with the focal node on Facebook. It was the summation of quantified attributes derived from Facebook data, specifically Social Distance (SD), number of Likes (nL), number of Comments (nC), Permaculture Awareness (PA) and Effective Awareness (EA). The SS is 40% of the total %LS score.
Social Distance (SD): Using a Modified Bogardus Social Distance Scale
Social Distance scores were determined using a modified Bogardus Social Distance Scale based solely on common Facebook Group memberships with the researcher-node. The Bogardus Social Distance Scale is a tool used in psychology to measure people’s willingness to participate in social contacts (Bogardus, 1926). Social Distance is categorized by the “degree of closeness” of the respondent to the researcher. Each degree in the scale is defined by a corresponding number of Groups with equivalent numerical scores. The more common Groups a respondent had, the higher degree of closeness he/she had with the researcher-node. No common Groups were categorized as a “Common FB friend” entailing an SD score of zero. At the other end of the spectrum, a “Perfect Relationship” category represented membership in all Groups with a perfect SD score of ten (10). The typology is as shown in Table 1.
Table 1. A modified Bogardus social distance scale was used to quantify Facebook group affiliations.
| Scale | Number of Common Facebook Groups | Score |
|---|---|---|
| Common FB Friend | 0 | 0 |
| Acquaintance | 1-2 | 5 |
| Affiliate | 3-5 | 6 |
| Close | 6-8 | 7 |
| Very Close | 9-12 | 8 |
| Extremely Close | 13-17 | 9 |
| Perfect Relationship | 18 | 10 |
Joining a Group implied that the respondent shared a common interest with the researcher-node although it was not an indicator that guaranteed personal interaction between the two. They may have a Perfect Relationship of 10 but may not necessarily interact online or in real life. Being clustered in the same Group could only increase the likelihood of the two interacting with one another.
Number of Likes (nL) Determined Using Programming Language R
The “like” button is a Facebook feature that enables a user to conveniently express approval, appreciation, or interest by clicking a “Thumbs Up” icon located below another user’s post. The post could either be a “status update,” a photo, or a video. “Likes” are a good indicator of interaction between users. Though “likes” can only represent limited interaction because it only conveys passive responses from users. This means that “liking” a post is subject to interpretation by the researcher (though Facebook has recently added emoticons/emojis to the “Like” button to specify reactions) but for the study, it was assumed that the respondents approved of what the researcher has posted.
Since “liking” posts have been a pastime for most Facebook users (an activity colloquially known as “auto-liking”), the study used this feature to determine the number of passive responses to the focal node’s Facebook posts. The methodology worked on the assumption that most of the focal node’s posts from 2012 to 2016 were about permaculture or were related to permaculture. To justify this assumption, the researcher utilized another social media platform, called Blogger, to streamline and put a timeframe on which posts to consider for the study.
The concept of permaculture was first encountered by the lead researcher while he was taking the Organic Agriculture course at the UP Open University in 2012. Since then, the lead researcher has been regularly writing about his permaculture-related activities on his Blogger website, Backyard Thinking: The Organic Plot to the Story of Laguna’s Backyard Gardens (http://www. organicbackyardthinking.blogspot.com). His first article entitled, “The Path to Good Health is Social Just as Much as it is Physiological,” was posted on September 24, 2012. And his latest article titled, “The Rise of Alternative Farming Systems: Feral Ecology (first of a 5-part weekly blog series),” was posted in January 5, 2016. The consistent blogging proved essential for determining the timeframe for the study.
To determine the timeframe and retrieve the number of “likes” on Facebook, the researcher used R, a programming language for statistical computing that data miners use for data analysis.
The first step was to manually post each of the blog articles’ web URLs (or web addresses) from September 24, 2012 to January 5, 2016 as a “Status Update” on Facebook’s dialogue box. The dialogue box has a “time and date” icon below it to specify when the post was made. This helped determine R at the starting point and the end point of which Facebook posts to search for “likes.”
Access to the Facebook account was given to a Facebook application which gathered its status updates. The application was written in a code in the R programming language, which used the Rfacebook package. Once the data set was downloaded, the data ha been sorted in terms of the publishing date of the status updates.
Once the status updates have been gathered, the number of individuals who logged comments and persons who liked for each status update were also gathered. The number of “comments” and “likes” that each person had made were also recorded. The output generated by R was a list of Facebook users (a total of 2,620) and their corresponding number of “likes.” From the R-generated list, the number of “likes” by each respondent were recorded.
After the number of “likes” of each respondent was determined, the range of number of “likes” was categorized and assigned corresponding numerical scores. The scores were determined and shown in Table 2. It should be noted that all respondents were given an equivalent nL score.
Table 2. Number of Facebook “likes” were given an equivalent score
| Number of Likes (nL) | Min-Max Likes per Month | Score |
|---|---|---|
| 0 | 0 | 0 |
| 1 to 10 | 0.025 - 0.250 | 3 |
| 11 to 20 | 0.270 - 0.500 | 5 |
| 21 to 30 | 0.525- 0.750 | 7 |
| 31 to 40 | 0.775 - 1.000 | 9 |
| 41 and above | 1.000 and above | 10 |
Number of Comments (nC) Determined Using Programming Language R
Aside from “likes,” Facebook also offers a function where users could “comment” or leave a text- based message on a specific Facebook post. The “comments thread” (the series of comments made on a post) could be an online forum for users to elaborate on a posted topic. More than just passively “liking” posts, users could interact more and exchange ideas and opinions with the poster and other users.
“Commenting” is an active response to a post. The methodology assumed that by posting a comment, the user (the respondent) was engaging the poster in a conversation. The same process to identify the number of “likes” was used to determine the number of comments from each respondent. A key difference though was that two lists were generated by R: 1) the total number of comments a user had made; and 2) the total number of status updates a user had commented on. For the purposes of the study, the latter list was chosen because this was considered more representative of the diversity of topics commented on at different times.
A slightly higher total score of fifteen (15), which was arbitrarily determined, was given to the nC score due to its more interactive nature compared to the passive nature of “liking” a post (Table 3).
Table 3. Number of Facebook comments was given an equivalent score.
| Number of Comments | Min-Max Likes per Month | Score |
|---|---|---|
| 0 | 0 | 0 |
| 1 to 7 | 0.025 - 0.250 | 3 |
| 8 to 14 | 0.270 - 0.500 | 6 |
| 15 to 21 | 0.525- 0.750 | 9 |
| 22 to 28 | 0.775 - 1.000 | 12 |
| 29 and above | 1.000 and above | 15 |
Permaculture Awareness (PA) and Effective Awareness (EA) scores
The final component of the Social Score was Permaculture Awareness (PA). It was a metric developed specifically for this study to determine if the sum of Facebook-based online interactions (SD, nL, and nC) with the poster (also known as the researcher-node) is sufficient to assume if the respondent have become indeed aware of permaculture.
PA is computed as follows:
PA = SD + nL + nC
where:
PA = Permaculture Awareness SD = Social Distance
nL = number of “Likes”
nC = number of “Comments”
Each of the 286 respondents’ PA scores was computed. Being simply aware of permaculture does not necessarily make a respondent an effective channel for information dissemination. To make the scoring process more accurate, another metric called Effective Awareness (EA) was developed to determine if the PA score was sufficient to make the assumption that the respondent would disseminate information to others. EA was a numerical incentive score given to Facebook users based on the total PA score. Respondents with a total PA score of twenty (20) and above were given plus five (+5) points on the total SS while those who had a score of 19 and below were given zero points. Based on a tool developed for this study, called the Table of Scenarios, those with a PA score of 20 points were at least “Active” to “Very Active” on Facebook.
Final Social Score (SS)
The SS was the online component of %LS. It was 40% of the total possible %LS score.
The final SS was computed as follows:
SS = SD + nL + nC (+ 5 if PA is > 20)
where:
SS = Social Score
SD = Social Distance
nL - number of “Likes”
nC = number of “Comments”
Computation of Permaculture Score (PS)
The Permaculture Score (PS) quantifies the actual or real-life permaculture-related activities of the respondents. It is based on two qualitative attributes identified by the researcher based on information deduced from real-life interactions and personal encounters with the respondents. The two attributes were Actual Project score (aps) and Permaculture Training score (Pts). The PS was the sum of the aps and the Pts. The PS was the offline component of the %LS. It comprises 60% of the %LS score.
Actual Project Score (aps)
The aps was a numerical expression of a respondent’s Permaculture Project or Initiative. This was determined by the researcher answering a simple YES/NO question regarding the existence of the respondent’s project based on his knowledge of the respondent. A YES answer had an equivalent of thirty-five (35) points while a NO answer had an equivalent of zero (0) points. The large point differential between the YES and NO scores emphasized the importance of having a tangible project or initiative in the scoring system.
Permaculture Training Score (Pts)
The Pts was a numerical expression of a respondent’s permaculture training. This was also determined by the researcher answering a simple YES/NO question regarding the actual participation or attendance of the respondent to a training session.
Training sessions considered for the study were limited to those which both the researchers and respondents had attended. It must be noted that trainings attended by a respondent on his/her own were not considered in the determination of the Pts.
A YES answer had an equivalent of twenty-five (25) points while a NO answer had an equivalent of zero (0) points. The large point differential between the YES and NO scores emphasizes the importance of having actual training in the scoring system. Though the scoring system allows for having a high SS (maximum of 40 points) compensate for the lack of permaculture training (maximum of 25 points) in some scenarios.
Final Permaculture Score (PS)
The PS was the offline or real-life component of %LS. It is 60% of the total possible %LS score.
The final PS is computed as follows:
PS = aps + Pts
Determining Percentage Linkage Strength (%LS)
The Percentage Linkage Strength (%LS) is a unique individual measure of relationship strength of a network node to a focal node in a social network based on online and offline permaculture experiences. It also translates to the strength of connectivity of one landscape patch to the other (Note: connectivity in this study refers to the ability of two landscape patches to share similar physical characteristics and design features without necessarily being geographically close to each other). The value of the relationship is based on online interactions, as represented by the Social Score (SS) and offline commonalities, as expressed by the Permaculture Score (PS). The %LS determines if a network node can create a virtual corridor where permaculture knowledge can be disseminated effectively through a social network and at the same time manifest actual landscape patches employing permaculture design principles.
Based on the SS and the PS, %LS is computed as follows:
%LS = [SD + nL + nC (+5 if PA > 20)] + [aps + Pts] / 100
Final Data Set and Scores Tabulation
The study used an MS Excel spreadsheet to input all of the computed scores and other necessary data gathered from the respondents’ Facebook profiles. These included “location” (city and/or province) and “friend since”--a Facebook feature that indicates when users became friends on Facebook (month and year). The layout of the spreadsheet is described as follows:
The first column contains the Facebook name of the respondents labeled as “Name.” For later purposes, the second column contains the geographic location (province) of the respondents labeled as “Cluster.” This comprises the spatial component of the study. The third column contains the month and year when the respondent became friends with the poster on Facebook. The column is labelled as “Friend Since.” This comprises the spatial component of the study. Columns 4 to 9 contain the SD, nL, nC, PA, +5, and EA scores respectively. These columns comprise the social component of the study. Columns 10 to 13 contain the ats, Pt, PS, and % LS scores respectively. And column 14, the last column, indicates whether the respondent creates a VC or not (NVC).
Table 4. Sample score sheet
| Name | Cluster | Friend Since | SD | nL | nC | PA | +5 | EA | ats | Pt | PS | %LS | Category |
|---|---|---|---|---|---|---|---|---|---|---|---|---|---|
| A | Metro Manila | 13-Nov | 6 | 7 | 6 | 19 | 0 | 19 | 35 | 25 | 60 | 79 | NVC |
| B | Metro Manila | 14-Mar | 7 | 7 | 3 | 19 | 0 | 19 | 35 | 25 | 60 | 79 | NVC |
| C | Metro Manila | 14-Oct | 6 | 9 | 6 | 21 | 5 | 26 | 35 | 25 | 60 | 86 | NVC |
| D | Metro Manila | 14-Mar | 6 | 9 | 6 | 22 | 5 | 27 | 35 | 25 | 60 | 87 | NVC |
| E | Laguna | 12-Aug | 6 | 10 | 9 | 25 | 5 | 30 | 35 | 25 | 60 | 90 | VC |
| F | Laguna | 11-Dec | 5 | 10 | 15 | 30 | 5 | 35 | 35 | 25 | 60 | 95 | VC |
| Laguna | 12-Jan | 6 | 10 | 15 | 31 | 5 | 36 | 35 | 25 | 60 | 96 | VC | |
| Metro Manila | 14-Jan | 6 | 10 | 15 | 31 | 5 | 36 | 35 | 25 | 60 | 96 | VC | |
| Metro Manila | 13-Jul | 6 | 10 | 15 | 31 | 5 | 36 | 35 | 25 | 60 | 96 | VC | |
| Pampanga | 13-Sep | 6 | 10 | 15 | 31 | 5 | 36 | 35 | 25 | 0 | 96 | VC | |
| Rizal | 12-Jan | 6 | 10 | 15 | 31 | 5 | 36 | 35 | 25 | 60 | 96 | VC | |
| Laguna | 13-Jul | 7 | 10 | 15 | 32 | 5 | 37 | 35 | 25 | 60 | 97 | VC | |
| Laguna | 13-Dec | 7 | 10 | 15 | 32 | 5 | 37 | 35 | 25 | 60 | 97 | VC | |
| Nueva Ecija | 14-Mar | 8 | 10 | 15 | 33 | 5 | 38 | 35 | 25 | 60 | 98 | VC |
Out of the two-hundred eighty-six (286) respondents who were initially selected to potentially create virtual corridors at the beginning of the study, only fourteen (14) respondents had %LS scores that were able to meet the final criteria to qualify as virtual corridors.
Identifying Virtual Corridors
A virtual corridor is created when a network node (respondent) has a qualified %LS score with the focal node (the researcher). Qualified network nodes have an SS of at least 30 points and a %LS of at least 75% (75 points). The scoring system showed that respondents needed to be “Active” or “Very Active” (See Table 5. - Table of Scenarios) on Facebook but at the same time have a permaculture-related project or initiative to create a virtual corridor
Interpretation of % Linkage Strength using the Table of Scenarios
The Table of Scenarios present sixteen (16) possible real-life scenarios that interpret the %LS score of each respondent. The scenarios, with equivalent score ranges, are as follows:
Social Score (SS) Scenarios
- Very Active on Facebook (34 to 40 points)
- Active on Facebook (20 to 33 points)
- Moderately Active on Facebook (12 to 19 points)
- Not Active on Facebook (0 to 11 points)
Permaculture Score (PS) Scenarios (with Project)
- With Project;With Training (60 points)
- With Project;Without Training (35 points)
Permaculture Score (PS) Scenarios (without Project)
- Without Project; With Training (25 points)
- Without Project; Without Training (0 point)
Total Score = SS + PS = 10 points
Table 5. Table of Scenarios
| Social (40%) | Sub-total | SS | Practice (60%) | PS | TOTAL | |||||||
|---|---|---|---|---|---|---|---|---|---|---|---|---|
| Scenario | SD | nL | nC | PA | EA | Pts | aps | %LS | VC | |||
| Very Active on FB w/ Training & Project | 10 | 10 | 15 | 35 | 5 | 40 | 25 | 35 | 60 | 100 | 1 | YES |
| Active on FB w/ Training & Project | 7 | 9 | 12 | 28 | 5 | 33 | 25 | 35 | 60 | 93 | 0.93 | YES |
| Moderately Active on FB w/ Training & Project | 6 | 7 | 6 | 19 | 0 | 19 | 25 | 35 | 60 | 79 | 0.79 | NO |
| Very Active on FB w/ No Training & w/ Project | 10 | 10 | 15 | 35 | 5 | 40 | 0 | 35 | 35 | 75 | 0.75 | YES |
| Not Active on FB w/ Training & Project | 5 | 3 | 3 | 11 | 0 | 11 | 25 | 35 | 60 | 71 | 0.71 | NO |
| Active on FB w/ No Training & w/ Project | 7 | 9 | 12 | 28 | 5 | 33 | 0 | 35 | 35 | 68 | 0.68 | NO |
| Very Active on FB w/ Training & No Project | 10 | 10 | 15 | 35 | 5 | 40 | 25 | 0 | 25 | 65 | 0.65 | NO |
Active on FB w/ Training &
No Project| 7 |
9 |
12 |
28 |
5 |
33 |
25 |
0 |
25 |
58 |
0.58 |
NO | |
| Moderately Active on FB w/ No Training & Project | 6 | 7 | 6 | 19 | 0 | 19 | 0 | 35 | 35 | 54 | 0.54 | NO |
| Not Active on FB w/ No Training & w/ Project | 5 | 3 | 3 | 11 | 0 | 11 | 0 | 35 | 35 | 46 | 0.46 | NO |
| Moderately Active on FB w/ Training & No Project | 6 | 7 | 6 | 19 | 0 | 19 | 25 | 0 | 25 | 44 | 0.44 | NO |
| Very Active on FB w/ No Training & No Project | 10 | 10 | 15 | 35 | 5 | 40 | 0 | 0 | 0 | 40 | 0.40 | NO |
| Not Active on FB w/ Training & No Project | 5 | 3 | 3 | 11 | 0 | 11 | 25 | 0 | 25 | 36 | 0.36 | NO |
| Active on FB w/ No Training & No Project | 7 | 9 | 12 | 28 | 5 | 33 | 0 | 0 | 0 | 33 | 0.33 | NO |
| Moderately Active on FB w/ No Training & No Project | 6 | 7 | 6 | 19 | 0 | 19 | 0 | 0 | 0 | 19 | 0.19 | NO |
| Not Active on FB w/ No Training & No Project | 5 | 3 | 3 | 11 | 0 | 11 | 0 | 0 | 0 | 11 | 0.11 | NO |
The scoring system implies that having a high PS score is vital to create a virtual corridor, although a high PS score does not automatically qualify a network node to create a virtual corridor. It has to have a high SS score as well. A high Total Score results in a high %LS which is an indicator of the likelihood that the respondent would create a virtual corridor. Respondents or network nodes that qualify to create virtual corridors are those that are:
- Very active on Facebook; who had training, and maintain a Project.
- Active on Facebook; had training, and maintain a Project.
- Very active on Facebook even if they had no training; provided they maintained a Project. (This essentially means that a high SS can compensate for lack of training.)
Construction of Sociograms using Meerkat Lite for the Top 10 Respondents
A social network map called a sociogram (Moreno, 1934 in Carington & Scott, 2011) is a graphic representation of social linkages in a social network. The study utilized sociograms as a way to illustrate how the respondents are socially connected to one another and to the researcher. Meaning, which network nodes are linked to the focal node. Unlike the %LS metric (which only illustrates a dyadic relationship of the focal node to another network node using a single line) a sociogram provides a larger picture of the whole network to conduct social network analysis.
To construct a sociogram, the researcher used a downloadable research tool called and Meerkat Lite.
Meerkat Lite (developed at AICML, Department of Computing Science, University of Alberta, under the leadership of Dr. Osmar Zaïane) is a social network analysis software developed specifically for social network analysis. It uses a programming language and commands to construct a sociogram. The software has several tools for social network analysis, metrics, and statistical tests.
GIS Animation using Google Earth and Camtasia Studio
Spatial and temporal data obtained from Facebook were used to create the GIS animation using Google Earth and Camtasia Studio. The spatial data based on the “location” section of a Facebook profile (Note: Personal verification of location was done for Facebook users who refrained from posting their actual location on their public profiles) was used to identify where to “pin” the network node on the map. Since Facebook can only provide provincial location, the network nodes were grouped into provincial “clusters” and then randomly pinned in an area within their respective clusters. The network nodes chronologically appear on the topographic map according to the “friend since” data provided by Facebook.
NetLogo Rumor Mill Simulation
A simulation study for rumor mill per year as time step has been done in NetLogo to emulate the spread of permaculture in a social network. The simulation was repeated via a NetLogo experiment in 1000 trials. This assumes a closed environment which stops if all people in an environment has heard the rumor. This scenario happens if the researcher and his friends suddenly stop accepting and making friend requests on Facebook.
The spread of a rumor happens for a random population of the four nearest neighbors of the rumor-spreader (north, south, east, west), as well as four randomly selected people in the environment.
Results and Discussions
The Percentage Linkage Strength of the top 10 respondents who were able to create Virtual Corridors (with a %LS of 90% and above and a Social Score of 30 and above) are presented in Table 6. For privacy purposes, only the initials of the respondents were used for the study.
The study revealed the respondents to be young organic farmers, urban gardeners, entrepreneurs, advocates, a student, and a musician.
Table 6. Computing for the % Linkage Strength of each respondent and Identification of Virtual Corridors.
| %LS Rank |
Respondent | Cluster | Friend Since | SD | nL | nC | PA | EA | SS | aps | Pts | PS | SS +PS |
%LS | VC or NVC |
|---|---|---|---|---|---|---|---|---|---|---|---|---|---|---|---|
| 1 | GI01 | NUEVA ECIJA | March 2014 | 8 | 10 | 15 | 33 | 5 | 38 | 35 | 25 | 60 | 98 | 0.98 | VC |
| 2 | MS02 | LAGUNA | July 2013 | 7 | 10 | 15 | 32 | 5 | 37 | 35 | 25 | 60 | 97 | 0.97 | VC |
| 3 | KL03 | LAGUNA | December 2013 | 7 | 10 | 15 | 32 | 5 | 37 | 35 | 25 | 60 | 97 | 0.97 | VC |
| 4 | TM04 | RIZAL | January 2012 | 6 | 10 | 15 | 31 | 5 | 36 | 35 | 25 | 60 | 96 | 0.96 | VC |
| 5 | PS05 | LAGUNA | January 2012 | 6 | 10 | 15 | 31 | 5 | 36 | 35 | 25 | 60 | 96 | 0.96 | VC |
| 6 | LM08 | METRO MANILA | July 2013 | 6 | 10 | 15 | 31 | 5 | 36 | 35 | 25 | 60 | 96 | 0.96 | VC |
| 7 | DC07 | PAMPANGA | September 2013 | 6 | 10 | 15 | 31 | 5 | 36 | 35 | 25 | 60 | 96 | 0.96 | VC |
| 8 | CG08 | METRO MANILA | January 2014 | 6 | 10 | 15 | 31| 5 |
36 |
35 |
25 |
60 |
96 |
0.96 |
VC | |
| 9 | DR09 | LAGUNA | December 2011 | 5 | 10 | 15 | 30 | 5 | 35 | 35 | 25 | 60 | 95 | 0.95 | VC |
| 10 | EF10 | LAGUNA | August 2012 | 6 | 10 | 9 | 25 | 5 | 30 | 35 | 25 | 60 | 90 | 0.90 | VC |
Sociogram and Computed Metrics
The sociogram was constructed according to actual Facebook friendships (how respondents met each other in real life and not based on the % LS score) with the researcher as the focal node in the network.
Actual friendships denote whether a network node formed a dyadic or a triadic relationship. The dyads illustrate that each network node is connected via the focal node while the triads illustrate that vertices 9, 6, 5, and 4 are connected via more than one network node.
Table 7. Dyadic and Triadic Relationships
| Respondent | Vertex ID (node) | Dyad (edge) | Triad (edge) |
|---|---|---|---|
| Researcher | 1 | 1 – 4 – 9 | |
| 1 – 5 – 6 | |||
| 1 – 6 – 8 | |||
| GI01 | 9 | 1 – 9 | 1 – 4 – 9 |
| MS02 | 6 | 1 – 6 | 1 – 5 – 6 |
| 1 – 6 – 8 | |||
| KL03 | 5 | 1 – 5 | 1 – 5 – 6 |
| TM04 | 11 | 1 – 11 | |
| PS05 | 3 | 1 – 3 | |
| LMD6 | 8 | 1 – 8 | 1 – 6 – 8 |
| DC07 | 7 | 1 – 7 | |
| CG08 | 10 | 1 – 10 | |
| DR09 | 2 | 1 – 2 | |
| EF10 | 4 | 1 – 4 | 1 – 4 – 9 |
| TOTAL | 11 nodes | 10 edges | 3 edges |
The Meerkat-generated sociogram (Figure 1) illustrate an egocentric network with 11 nodes (or vertices in Meerkat’s language) and 13 edges (undirected graph) that includes the researcher as the focal node.
Using the analysis function of the software, the network was computed to have a density of 0.118, an average degree of 2.364, a clustering coefficient of 0.43, an average shortest path distance of 1.764, and an assortativity coefficient of -0.72. The network was displayed using an Egocentric PageRank metric layout.
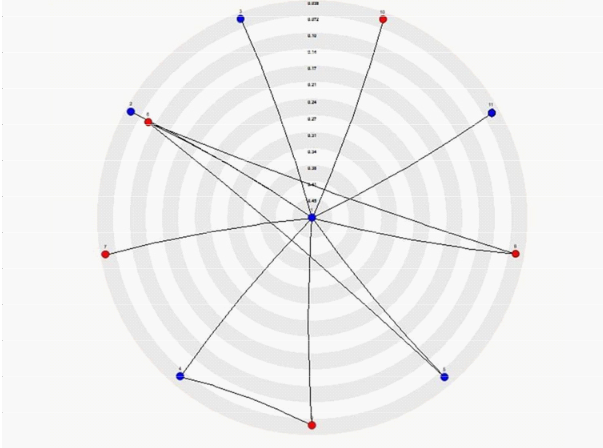
Figure 1. The Meerkat Lite sociogram displays 11 nodes with 13 edges in an undirected egocentric network
GIS Animation
The GIS presentation using Google Earth and Camtasia Studio illustrated the increase of network nodes in a geographic area per year using the “Friend Since” and location information gathered from Facebook profiles.
The first frame illustrated how the focal node (the researcher) was grouped with other nodes that are his Facebook friends since 2011, forming a cluster. The succeeding frames for 2011 to 2016 showed how the other clusters chronologically appeared on the Philippine map, based on the timeline by which they became Facebook friends with the focal node. Then, all 286 network nodes appeared as clusters on the Philippine map pinned on their respective locations. It should be noted that the clusters were made up of one or more nodes.
After illustrating where the network nodes are on the map, the next frame highlighted the top 10 network nodes that created virtual corridors linked to the focal node by a line to illustrate linkage strength and socio-spatial connectivity. The camera then hovered and zoomed into each network node, revealing a Facebook photo of the permaculture project of each. Figure 2 shows the final frame of the GIS animation, showing all 10 network nodes stemming from the focal node.
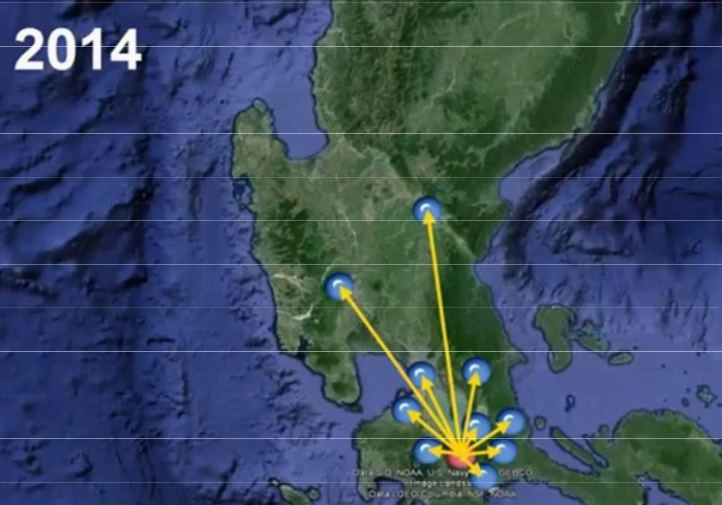
Figure 2. Final frame of the GIS animation showing all 10 network nodes stemming from the focal node
Rumor Mill Results
Using a graphic called “turtles” to represent network nodes, the NetLogo rumor mill simulation illustrated how the discovered socio-spatial Facebook network can replicate network nodes, and thus the practice of permaculture, for the next two years.
Modelling the spread of permaculture after a “rumor”, NetLogo produced the following results of the rumor mill simulation:
- Percentage number of people who heard the rumor:
- First Year to Second Year
- Per month: 4.1812% to 8.3385%
- Percentage number of people who practiced permaculture
- First Year to Second Year
- Per month: 0.3482% to 0.5210%
The next step was to produce the same experiment for the eight nearest neighbors. The spread of a rumor happened to a random population of the four nearest neighbors of the rumor-spreader (the focal node located in the north, south, east, and west directions) and to the eight nearest neighbors (i.e. considering secondary directions), as well as four randomly selected people in the environment.
The following results transpired for a 4-neighborhood connectivity:
- Percentage number of people who heard the rumor:
First Year to Second Year
Per month: 41.8124% to 83.3249% - Percentage number of people who practiced permaculture.
First Year to Second Year
Per month: 0.3482% to 0.5210%
The following results transpired for an 8-neighborhood connectivity:
- Percentage number of people who heard the rumor:
First Year to Second Year
Per month: 40.9200% to 83.3332% - Percentage number of people who practiced permaculture
First Year to Second Year
Per month: 0.3432% to 0.5207%
As an experiment in a controlled environment, the limitation of the model is that it assumes that the current number of friends of the focal node remains the same for two years. The virtual corridor creation process only occurs within the existing social network.
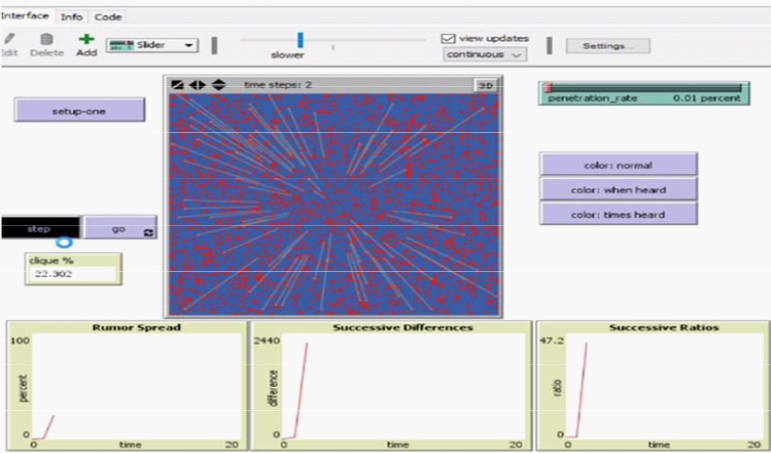
Figure 3. Screenshot of the NetLogo rumor mill simulation.
Synthesis of the Results
Computing for the Percentage Linkage Strength of each respondent provided actual values to the lines connecting each node to the focal node in the sociogram. Aside from illustrating the connections, the numerical values provided a detailed representation of the relationships based on offline and online activities. The GIS animation then puts into perspective where and when the relationships actually occurred. It demonstrates the extent of the effect of the virtual corridor creation process in the context of a map. Finally, the rumor mill simulation models how the virtual corridor creation process may continue based on the current level of activity of the respondents.
Summary of Findings
Fourteen out of the 286 network nodes were discovered to have created Virtual Corridors in the researcher’s Facebook social network. Ten out of those 14 network nodes have a Percentage Linkage Strength of 90% and above and a Social Score of 30 points and above, indicating frequent Facebook usage.
The top 10 network nodes have an average of 4.9 common Facebook group affiliations, with Good Food Community and the Philippine Permaculture Association having the most number of common memberships.
An average of 280 Facebook “likes” or 9.66 Facebook “likes” per month were made by the top 10 network nodes from September 2012 to January 2016
An average of 43 Facebook “comments” or 1.49 Facebook “comments” per month were posted by the top 10 network nodes from September 2012 to January 2016.
All 10 network nodes have a permaculture project or initiative (mostly home gardens) in their respective geographic locations.
All 10 network nodes have attended at least one permaculture training session or workshop with the focal node.
Implications of Virtual Corridor Creation
- On Social Networks
- A socio-spatial network was created.
- Socio-spatial homophily of network nodes was discovered using the methodology.
- The high % Linkage Strength of the 10 network nodes illustrates their ability to be effective channels of information sharing and practice.
- Virtual corridors can be created over time as network nodes interact more with each other.
- Virtual corridor creation is dependent on the online activity and permaculture experience of a focal node.
- Discovered network nodes can be focal nodes themselves.
- Focal nodes have a potentially vast network to share permaculture information with.
- On Landscape Patches
- Similarity of specific permaculture practices can now be compared and studied.
- Socio-spatial homophily indicates that landscape patches are likely to feature permaculture• design characteristics such as creation of microclimates, application of organic agriculture, energy cycling, and use of renewable energy.
- Permaculture projects can either be located in diverse urban or rural landscape patches.
- Virtual corridor creation may lead to the discovery of energy zones— areas with the most permaculture activity.
The emergence of alternative farming systems has been gaining popularity in the last decade and making its way into mainstream culture much faster than in previous decades. Thanks to “digital highways” (Morris 2012), such as social media, ecology-based farming systems challenging the dominant industrial agriculture model (Diver, 1994) have found its way in the hands of individuals outside of the academe. Permaculture, in particular has achieved international fame (Diver, 1994; Ferguson & Lovell, 2013). Morris explains how permaculture has spread in today’s Society 2.0:
“Now in terms of techniques spread virally through YouTube videos, support and information exchange bulletin boards, blogs, national societies and local networks; its businesses and courses proliferate” – (2012)
With issues such as climate change, food security and biodiversity loss headlining the news, individuals and communities are searching for ways to address these issues by themselves. Alternative agriculture gives common people the power and knowledge to challenge the prevailing model of conventional (also called industrial) agriculture.
Despite alternative farming and permaculture’s rising popularity in popular culture, there continues to be a lack of scientific research in these disciplines (Veteo & Lockyer 2008 as cited in Haluza- DeLay & Berezan, 2010). A so-called “feral ecology” (Morris, 2012) has come out of the confines of the gated scientific community and into the hands of the public thanks to the knowledge- sharing power of the internet. The perception of the scientific community towards permaculture continues to be negative due to its “feral” nature and the credibility of the people who practice it—those outside of the academe as demonstrated by the results of the study.
In spite of permaculture’s online popularity, it has yet to gain significant attention in the scientific community (Haluza-DeLay & Berezan, 2010; Ferguson & Lovell, 2013). Most research can be based on what Morris (2012) calls “feral feedback”—feedback provided by individuals working with and within alternative farming systems such as permaculture. These feedbacks pass through social networks that create virtual corridors.
Conclusions and Recommendations
It must be pointed out that 10 out of a possible 286 network nodes is a small sample size to conclude anything regarding how virtual corridor creation can significantly shape and influence landscape patches, especially on a macro-scale. But the important take away from this study is that online social networks have an equivalent spatial network when it comes to permaculture and its designers. The study was able to provide a glimpse of what virtual corridors are and what they are capable of doing when created.
A deep understanding of permaculture and the social values it promotes is critical to the appreciation of the study. If permaculture is viewed simply as another alternative approach to conventional agriculture, then the study will have nothing new to contribute to scientific knowledge.
Permaculture’s strong emphasis on design, ethics, and the intrinsic values it imparts to its practitioners demonstrates that a change in perspective manifests into positive actions that would benefit both the environment and society. This is so because intrinsic changes in one’s self (intangibles) are much more difficult to quantify, observe and measure in comparison to geophysical or natural phenomena (tangibles). An important feature of this paper’s framework is the assumption that the management of landscapes is not just an ecological issue. Rather, it is a personal and social issue being discussed and shared within and across social networks.
The field of landscape ecology gives permaculture the scientific backbone it needs to warrant attention in the academic and scientific realms. Landscape ecology also opens the door to discuss and investigate the validity of the technical aspects of permaculture design methods and its impact on landscape structure and function. Social network analysis, on the other hand, provides the tools to study complex relationships of both people and places.
Relying on the strength of socio-spatial relationships between permaculture designers via virtual corridors, Facebook relationships can theoretically translate into the connectivity of landscape patches. Though not connected physically, permaculture designers and their respective projects are virtually connected to each other creating a network of permaculture sites -- sites that mindfully and consciously transform landscapes for the better. In other words, Facebook, or social media in general, can be used as platforms where permaculture values and practices can be shared, expressed and manifested into actual ecological landscapes.
Permaculture designers are increasing in number thanks to the courses being offered worldwide both on-site and online. Individual practices (Jensen, 2009) have been reviewed but the overall effects of these projects working in sync have not been studied yet. The movement has created an “ecological culture” (Morris, 2012) an ecological habitus (Haluza-DeLay & Berezan, 2010), and a connectivity between and across individual designs and communities that stimulate cooperation among its members (Peeters, 2011)
References
Acres USA. (ND). What is Eco-agriculture? Retrieved from http://www.acresusa.com/eco- agriculture/
Bennet, A.F. (2003). Linkages in the landscape: The role of corridors and connectivity in wildlife conservation . School of Ecology and Environment, Deakin University – Melbourne Campus, Burwood, Victoria 3125, Australia.
Bogardus, E.S. (1926). Social distance in the city. Proceedings and Publications of the American Sociological Society. 20, 1926, 40–46.
Borgatti, S.P. & V. Lopez-Kidwell. (2011). Network theory. The SAGE Handbook of Social Network Analysis. Singapore: SAGE Publications Asia-Pacific Pte Ltd.
Diver, S. (1994). Permaculture and sustainable agriculture: Introduction to low-input sustainable agriculture. Pages 152-158 in Proceedings of the 13th Annual Oklahoma Horticulture Industries Show, 7- 8 January 1994, Tulsa Jr. College-Northeast Campus, Tulsa, Oklahoma.
Carrington, P. & Scott, J. (eds., 2011). The Sage handbook of social network analysis. Sage.
Chalker-Scott, L. (2010). Permaculture: My final thoughts. Retrieved from https://sharepoint.cahnrs. wsu.edu/blogs/urbanhort/archive/2010/05/26/permac ulture-my-final-thoughts.aspx.
Chen, J., Saunder, S.C., Brosofske, K., & Crow, TR (Eds). (2006). Ecology of hierarchical landscapes: From theory to application. New York: Nova Publishers.
Ferguson, R.S. & S.T. Lovell. (2013). Engaging ecological literacy from the ground up: The influence and impact of the permaculture movement. Agronomy for Sustainable Development. Multifunction Landscape Analysis and Design Laboratory (MLAD). Chicago: University of Illinois at Urbana-Champaign.
Ferguson, R.S. & S.T. Lovell. (2014). Permaculture for agroecology transition: Design, movement, practice, worldview. A review. Agronomy for Sustainable Development. Multifunction Landscape Analysis and Design Laboratory (MLAD). Chicago: University of Illinois at Urbana-Champaign.
Forman, R.T.T. & M. Godron. (1986). Landscape ecology. New York: John Wiley and Sons.
Foronda, E. (2016). Geographic Information Systems (GIS) animation using Google Earth and Camtasia. (Unpublished)
Freibauer, A., E. Mathijs, G. Brunori, Z. Damianova, E. Faroult, JG I Gomis, L O’Brien, & S. Treyer. (2011). Sustainable food consumption and production in a resource-constrained world. European Commission – Standing Committee on Agricultural Research (SCAR), The 3rd SCAR Foresight Exercise. Retrieved from http://ec.europa.eu/research/agriculture/scar/pdf/scar_ feg_ultimate_version.pdf .
Grayson, R. (2007). A short and incomplete history of permaculture. Retrieved from http://pacific- edge.info/2007/07/a-short-and-incomplete-history-of-permaculture/
Grudz, A. & C. Haythornthwaite. (2011). Networking online: Cybercommunities. The SAGE Handbook of Social Network Analysis. Singapore: SAGE Publications Asia-Pacific Pte Ltd.
Haluza-DeLay, R. & R. Berezan. (2010). Permaculture in the city: Ecological habits and the distributed ecovillage. Localizing Environmental Anthropology: Bioregionalism, Permaculture, and Ecovillage Design for a Sustainable Future. New York: Berghahn Books.
Hillis, D.C.K. (2011). The wired village: Sustainability, social networking and values in an urban permaculture community. A Masters Research Thesis, Melbourne Graduate School of Education, The University of Melbourne. Retrieved from https://minerva-access.unimelb. edu.au/handle/11343/37690.
Holmgren, D. (2012). Essence of permaculture: A summary of permaculture concepts and principles beyond sustainability (English Version) . Retrieved from https://permacultureprinciples.com/ wp-content/uploads/2013/02/Essence_of_Pc_EN.pdf
Jensen, M.V. (2009). Applied landscape ecology by multi-function agriculture: [A] comparison study of landscape ecology and permaculture design. Aalborg University, Denmark; Mendel University of Agriculture and Forestry in Brno Czech Republic.
Lawton, G. (2009). An introduction to permaculture design. A Documentary Film.
Leser, H. (1991). Landschaftsökologie. Ansatz, Modelle, Methodik, Anwendung. Ulmer: Stuttgart.
Marin, A. & B. Wellman. (2011). Social network analysis: An introduction. The SAGE Handbook of Social Network Analysis. Singapore: SAGE Publications Asia-Pacific Pte Ltd.
McGarigal, K. (n.d.) Introduction to landscape ecology. Retrieved from www.umass.edu/landeco/ about/landeco.pdf
Miloslav L, J Vavra, & Z. Sokolickova. (2012). Cultural ecology: Contemporary understanding of the relationship between humans and the environment . Journal of Landscape Ecology 5(2):12- 24 • Retrieved from http://www.degruyter.com/view/j/jlecol.2012.5.issue-2/v10285-012- 0050-z/v10285-012-0050-z.xml.
Mollison, B. (1988). Permaculture: A designers’ manual . Australia: Tagari Publications.
Morris, F.A. (2012). When science goes feral . NJAS – Wageningen Journal of Life Sciences, 59 (1-2) 7-9. Retrieved from http://www.sciencedirect.com/science/article/pii/S1573521412000048
Naveh, N. (2000). What is holistic landscape ecology? A conceptual introduction. Landscape and Urban Planning 50(1-3): 7-26.
Naveh , Z. (1999). Transdisciplinary challenges for landscape ecology facing the post-industrial information society . Proceedings of “Nature and Culture in Landscape Ecology, Experience for the 3rd Millennium.”
Naveh, Z. & Lieberman, A.S. (1984). Landscape ecology: Theory and application . New York: Springer.
Obrero, R.J. (2016). Code for netlogo rumor mill simulation of permaculture practitioners on Facebook . Unpublished.
Odum, E.P. (1971). Fundamentals of ecology . Philadelpia: Saunders.
Odum, H.T. (1995). Self-organization and maximum empower . In C. A. S. Hall (Ed.), Maximum Power: The Ideas and Applications of H. T. Odum. Colorado: Colorado University Press.
Padmavathy K. & G. Poyyamoli. (2011). Alternative farming techniques for sustainable food production . In E. Lichtfouse (Ed.), Genetics, Biofuels, and Local farming System. New York: Springer.
Peeters, B. (2011). Permaculture as alternative agriculture . Kasarinlan: Philippine Journal of Third World Studies 2011 (1-2): 422-434.
Pickett, S.T.A. & M.L. Cadenasso. (1995). Landscape ecology: Spatial heterogeneity in ecological systems . Science New Series, Vol. 269 (5222) 331-334. Retrieved from http://www.edc.uri. edu/nrs/classes/nrs534/nrs_534_readings/PickettCadenasso_Science1995.pdf
Sanderson, J. & L. D. Harris (eds.). (2000). Landscape ecology: A top-down approach . USA: Lewis Publishers.
Schreck, A., C. Getz, & G. Feenstra. (2012). Social sustainability, farm labor, and organic agricultures: Findings from an exploratory analysis . University of California, Department of EPSM 207, Agriculture and Human Values.
Scott, R. (2010). A critical review of permaculture in the United States – Self-Published Article. Education Policy Studies, University of Illinois. Retrieved from http://robscott.net/2010/ comments/
Turner, M.G. (1989). Landscape ecology the effect of pattern on process . Annu. Rev. Ecol. Syst. 1989. 20:171-97. Retrieved from http://landscape.zoology.wisc.edu/People/Turner/ Turner1989ARES.pdf
Turner, M.G. (1990). Spatial and temporal analysis of landscape patterns . Landscape Ecology, 4 (1) 21-30. Retrieved from https://link.springer.com/article/10.1007/BF02573948.
Wilensky, U. (1997). Netlogo rumor mill model . Retrieved from http://cclnorthwestern.edu/netlogo/ models/RumorMill. Center for Connected Learning and Computer-Based Modeling. Northwestern University, Evanston, IL.
Wilensky, U. (1999). NetLogo . Retrieved from http://cclnorthwestern.edu/netlogo/. Center for Connected Learning and Computer-Based Modeling. Northwestern University, Evanston, IL.
Zaiane, O. & R. Goebel. (2002). Meerkat lite: A social network Analysis tool . Alberta Innovates for Machine Learning
International Journal on Open and Distance e-Learning, Vol. 3 No. 2, December 2017 Issue